Why the popular view of animals living in the wild is wrong

In recent years there has been a significant increase in concern for wild animals, likely awakened by powerful visual media such as wildlife photography, online videos, and documentaries. People increasingly want to know how we can help reduce the harms animals suffer due to both human action and natural reasons.
Despite this, many people still hold an unrealistically optimistic view of animals living good lives in the wild in which the happiness they enjoy outweighs the suffering they endure. One of the main reasons for this is that most people don’t have an accurate image of the animals who live in the wild and their relative population numbers. When asked to imagine an animal living in the wild, people usually think of large exotic animals, mostly mammals and sometimes birds, who are not at all representative of wild animals.
A wholly unrepresentative view of animals
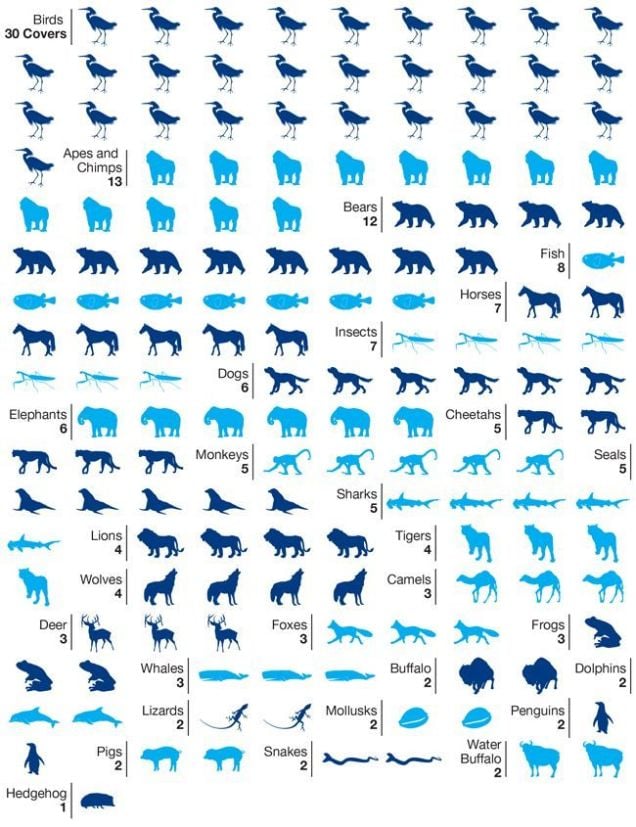
Emotionally charged images coupled with compelling narratives involving wild animals help create and reinforce this distorted view of animal populations living in the wild. Some time ago, National Geographic,1 a journal generally considered to be authoritative in its depictions of the natural world, conducted a study of the animals featured on its covers over the last 55 years. 153 of its 665 illustrated covers have featured animals. What’s interesting here is which animals have been featured. The journal’s intention in choosing the animals for their covers was to depict the animals that their stories were about, or those that symbolized the stories they wanted to tell. Their intention was not to depict animals in a way that is representative of their relative populations. However, the animals people see depicting nature tend to be viewed as the animals representative of nature.
The following graphic produced by National Geographic shows this:

To see the extent to which the numbers of animals in the graphic are different from the real numbers of animals living on earth, consider the following estimates of the total numbers of types of animals in the wild:2
- Birds: between 6 x 10¹⁰ and 4 x 10¹¹
- Mammals: between 1011 and 1012
- Reptiles: between 1012 and 1013
- Amphibians: between 1012 and 1013
- Fishes: over 1013
- Insects: between 1018 and 1019
- Other arthropods: between 1018 and 1021
- Other invertebrates: over 1022
The magazine’s graphic shows that only 9 covers have featured invertebrates (7 insects and 2 mollusks), that is, 5.88% of the total, despite the fact that invertebrates account for over 99.999999% of all the animals in the wild.
The way animals are grouped in the graphic is also illuminating. In their report, National Geographic proclaims that “birds lead in the cover sweepstakes.” But this is only because, with one species excepted, all birds are grouped together, while mammals are distinguished in different groups (apes, bears, elephants, monkeys, lions, tigers, etc.) in the 92 covers with mammals.
Mammals amount to more than 60% of the featured animals although they are less than 0.0000001% of the animals that exist on the planet. Birds have been featured on almost 20% of National Geographic’s covers, when they are less than 0.00000001% of the animals living in the wild.
Even if we considered only vertebrates, the true numbers of animals still would not be well represented. Among the 144 vertebrates featured, only 4 of them have been reptiles, 3 amphibians, and 13 fishes, when animals so classified may be ten times as numerous as mammals and more than twenty times as numerous as birds.
The graphic displays penguins separately as if they weren’t birds, and sharks as if they weren’t fishes. This is most likely done simply because those animals are interesting to the public, even though they are minorities and do not constitute separate categories. Different species of felines are also displayed separately while insects are all grouped together, despite the fact that, while there are about 40 feline species, it is estimated that there are several million species of insects.3
Even though the intention of the magazine was to depict animals who would be representative of their stories and not necessarily of nature as such, the choice of stories and animals depicted in the magazine does contribute to a distorted view of animals in the wild and what life is typically like for them.
Why knowing the relative numbers of types of wild animals is crucial to understanding the relative amounts of suffering and happiness in the wild
The amount of suffering in the wild depends on the different survival rates of the animals living within it. National Geographic tends to feature the animals that are most iconic while not prioritizing stories featuring less popular types of animals.
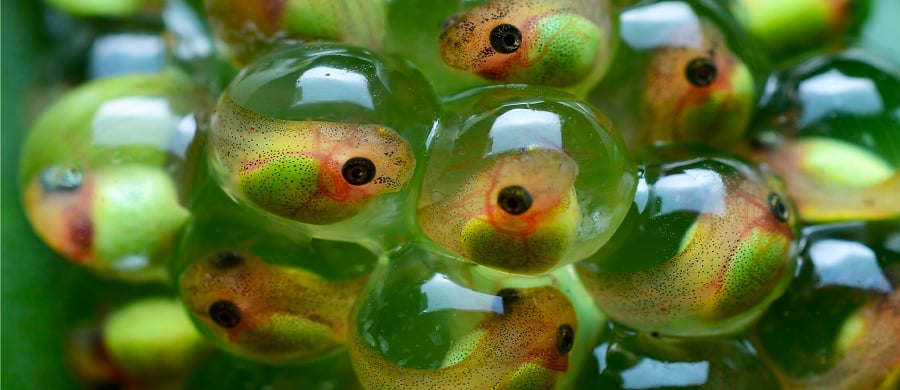
However, because they reproduce by having huge litters or laying huge numbers of eggs, the less popular animals are among the ones with the lowest survival rates. This reproductive strategy, which was traditionally known as r-selection, is followed by nearly all animals.4 Rats, for instance, give birth to hundreds of pups during their lives, frogs can lay thousands of eggs, and fishes can lay millions of eggs. But, on average, only one animal per parent will survive. The others die, many of them when they are already fully sentient and in painful ways (such as starving or being killed by other animals). This means that the vast majority of the animals who come into existence live very short lives in which they experience little more than suffering. In many cases, the agony of dying immediately upon coming into existence pervades their entire lived experience.
Only a relatively tiny number of animals in the wild (basically some mammals and birds) produce one offspring each time and invest effort in caring for them, greatly increasing their chances for survival. Traditionally this was called K-selection.5 Others follow a mixed reproductive strategy, having several offspring to whom they give some parental care. However, as we have seen, most animals in nature are invertebrates, most of whom have huge numbers of offspring and, therefore, tiny chances of survival. Even the majority of vertebrates are fishes who have huge numbers of offspring as well. And so do rodents, who are the majority of mammals.
This does not mean that only young animals suffer in nature. Adult animals also suffer for a number of reasons such as extreme weather conditions, disease, hunger and thirst, as well as accidents and injuries. Still, the main reason why suffering vastly exceeds happiness in the wild is the tiny proportion of animals who survive, which is due to the reproductive strategy followed by most animals. More than 99.999999999% of animals by numbers are members of species that reproduce by bringing into existence huge numbers of progeny, that is, those traditionally called r-strategists. As a result, most die shortly after coming into existence, often in painful ways.
In contrast, National Geographic’s list of animal covers includes 63 mammals and 2 birds traditionally classified as K-selected, 29 mammals following a mixed reproductive strategy, and 30 other birds with unspecified reproductive strategies. Finally, 4 reptiles, 3 amphibians, 13 fishes, 7 insects and 2 mollusks, all of whom reproduce by having huge clutches, complete the selection.
Why is this a problem? A distorted view of the populations of animals living in the wild manifests in a lack of concern about the harms they suffer and lack of interest in discovering ways to help them. This inaccurate view is harmful for animals, as it contributes to the misconception that animals live mostly good lives in nature.
This view among the public is reinforced and perpetuated when the animals most typically featured by popular science magazines such as National Geographic aren’t reflective of the most common animals. You can help by educating yourself and others about the actual populations of animals in the wild and the situations they face. If you work or interact with science magazines or the media, or if you can write letters to editors, encourage them to give more coverage to the all but ignored majority of animals and to explain that nature is not an idyllic place for them.
Notes
1 Newman, C. (2014) “Graphic: What animals appear most on National Geographic’s covers?”, National Geographic, December 31 [accessed on 2 January 2017].
2 National Museum of Natural History & Smithsonian Institution (ca. 2008) “Numbers of insects (species and individuals)”, Encyclopedia Smithsonian [accessed on 5 January 2015]. Tomasik, B. (2009) “How many wild animals are there?”, Essays on Reducing Suffering [accessed on 15 December 2016]. Tomasik, B. (2012) “One trillion fish”, Essays on Reducing Suffering [accessed on 5 January 2015].
3 Gaston, K. J. (1991) “The magnitude of global insect species richness”, Conservation Biology, 5, pp. 183-196. Chapman, A. D. (2009) Numbers of living species in Australia and the World, 2nd ed., Toowoomba: Australian Biodiversity Information Services [accessed on 6 January 2017]. Hamilton, A. J.; Basset, Y.; Benke, K. K.; Grimbacher, P. S.; Miller, S. E.; Novotný, V.; Allan Samuelson, G. A.; Stork, N. E.; Weiblen, G. D. & Yen, J. D. L. (2010) “Quantifying uncertainty in estimation of tropical arthropod species richness”, The American Naturalist, 176, pp. 90-95. Mora, C.; Tittensor, D. P.; Adlf, S.; Simpson, A. G. & Worm, B. (2011) “How many species are there on Earth and in the ocean?”, PLOS Biology, 9 (8) [accessed on 6 January 2017].
4 Gould, S. J. (1982) “Nonmoral nature”, Natural History, 91, pp. 19-26. Sagoff, M. (1984) “Animal liberation and environmental ethics: Bad marriage, quick divorce”, Osgoode Hall Law Journal, 22, pp. 297-307 [accessed on 6 January 2017]. Ng, Y.-K. (1995) “Towards welfare biology: Evolutionary economics of animal consciousness and suffering”, Biology and Philosophy, 10, pp. 255-285. Clarke, M. & Ng, Y.-K. (2006) “Population dynamics and animal welfare: Issues raised by the culling of kangaroos in Puckapunyal”, Social Choice and Welfare, 27, pp. 407-422. Horta, O. (2010) “Debunking the idyllic view of natural processes: Population dynamics and suffering in the wild”, Télos, 17 (1), pp. 73-88 [accessed on 5 January 2017]; (2015) “The problem of evil in nature: Evolutionary bases of the prevalence of disvalue”, Relations: Beyond Anthropocentrism, 3, pp. 17-32 [accessed on 6 November 2015].
5 The reason these terms are no longer used is that they were typically used to mean not only whether certain living organisms reproduce by having large or small numbers of offspring, but also other feature of their life histories such as how old they are when they reproduce, how long they live, etc., and some of these characteristics were later discovered to be inaccurate. See about this Pianka, E. R. (1970) “On r– and K-selection”, The American Naturalist, 104, pp. 592-597; Pianka, E. R. (1972) “r and K selection or b and d selection?”, The American Naturalist, 106, pp. 581-588 [accessed on 11 December 2013]; Parry, G. D. (1981) “The meanings of r- and K- selection”, Oecologia, 48, pp. 260-264 [accessed on 15 February 2013]; Boyce, M. S. (1984) “Restitution of r- and K–selection as a model of density-dependent natural selection”, Annual Review of Ecology and Systematics, 15, pp. 427-447 [accessed on 15 February 2014]; Stearns, S. C. (1992) The evolution of life histories, Oxford: Oxford University Press. See also: Reznick, D.; Bryant, M. J. & Bashey, F. (2002) “r-and K-selection revisited: The role of population regulation in life-history evolution”, Ecology, 83, pp. 1509-1520.