How do we determine which problems deserve priority?
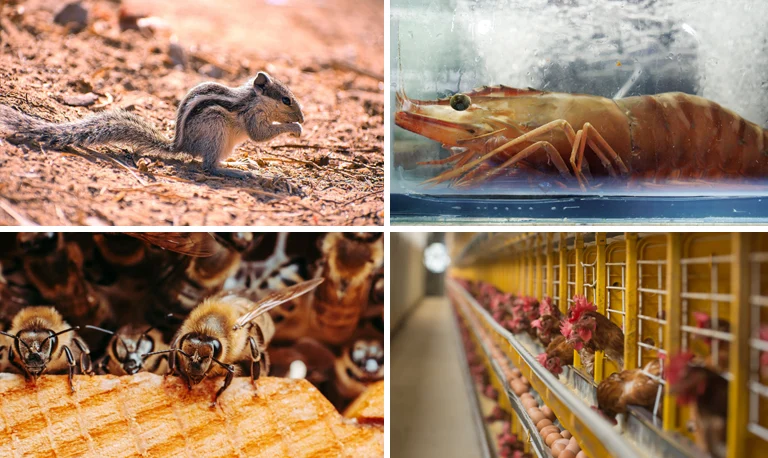
Those who defend animals are often criticized for dedicating themselves to this cause instead of defending human beings. The usual response is that everyone has the right to choose which problem they want to work on, because all problems are equally important.
This debate illustrates how two ideas dominate our thinking: that human beings should take priority, and that all problems are equally important. What if both ideas were wrong? What if some problems were more important than others, but that didn’t necessarily coincide with the problems affecting human beings?
To answer this question, we need to investigate how we can assess which problems should be prioritized. In this piece, we’ll first look at some priority criteria. Then, based on those criteria, we’ll investigate which of the world’s problems should currently receive priority.
Impartial priority criteria
A priority criterion must be impartial — that is, it can’t unjustifiably favor or disadvantage one group over another. The priority criteria listed below, therefore, establish the conditions under which a problem receives priority. If each of them is important in determining how much priority a problem deserves,1 then no single criterion alone is sufficient to decide questions of priority — a decision that must be made based on the full set of criteria.
Severity of the situation
The first of these criteria is the severity of the situation: all else being equal, the more severe a problem is, the stronger the reasons to prioritize it. This criterion alone is enough to cast doubt on the idea that all problems are equally important, because different situations vary significantly in their degree of severity.
But how do we measure the severity of a situation? There are different ways to do so, though two criteria are widely used: the number of victims and the level of harm per victim (for example, how much each victim suffers, or the degree to which their deaths are premature). In short, the more victims there are, the more severe the situation; and the greater the harm per victim, the more severe the situation.
When severity criteria conflict
Sometimes, when comparing two situations, the one with more victims is also the one where the victims are worse off. In those cases, it’s easy to see which is more severe. In other cases, however, the situation with more victims is not the one where the victims are worse off. How should we proceed in such cases to determine which situation is more severe?
There are different methods for doing so.2 Here are some of them:
Aggregated harm. One option is to add up the harm suffered by each victim to obtain the total aggregated harm. An objection to this approach, however, is that it could give priority to a problem with a large number of victims, even if the individual harm to each of them is quite small.
Threshold cutoffs. Another option is to treat both criteria as independent and to allow either to carry more weight depending on the situation. One possibility here would be to set thresholds. For instance, if the harm to each individual in the case with fewer victims is “x” times greater than the harm to each victim in the case with more victims, the individual harm criterion carries more weight; otherwise, the number of victims carries more weight.
Variable weighting with diminishing returns. Another option is to set no thresholds, so that the weight of each criterion shifts continuously and gradually as it becomes increasingly “satisfied.” For example, as the number of victims decreases, the number-of-victims criterion loses weight; as the situation of each victim improves, the individual severity criterion loses weight.
Other methods exist, which we’ll discuss at the end of this piece
What is the most severe situation we can actually influence?
It’s important to analyze not only which situations are most severe, but also which of the situations we can actually influence are most severe. To make this clearer, consider the following example.
Suppose problem A involves 900,000 victims, problem B involves 500,000 victims, and all victims in both cases are in equally severe situations. According to the severity criteria we’ve just seen, we should prioritize A. However, suppose the following: the most we can do about problem A is help 400,000 victims (unfortunately, nothing can be done for the other 500,000); while it’s possible to help 450,000 of the 500,000 victims of problem B.
In short, even though problem A represents a worse situation than problem B overall, when we compare the worst situations we can actually influence, it’s problem B that presents the worst one.
This is therefore another important factor in setting priorities: we need to know which are the worst situations we can actually influence (knowing which situations are worst is useless if we can do nothing to improve them). It’s important to note, however, that this factor — the tractability of the problem — changes over time. Some situations we currently can’t influence may become influenceable in the future (which depends, in part, on how much we invest in researching how to do so).
Degree of neglectedness
Another important factor in deciding priority is the degree to which each problem is neglected. All else being equal, the more neglected a problem is, the stronger the reasons to prioritize it. As explained below, there are at least two reasons for this:
Distribution of effort
Let’s return to the previous example. Suppose that after assessing problems A and B, we decide to prioritize problem B because it presents the most severe situation we can influence. But now suppose that others, following the same reasoning, have also decided to prioritize problem B. If we knew about their decisions, we could invest our resources in trying to solve problem A instead, increasing the probability that both problems get addressed. In short, the more people who are already working on a problem, the greater the chances it will be resolved without our contribution. That’s one reason to prioritize more neglected problems.
Diminishing marginal returns
The more neglected a problem is, the greater the positive impact of having one more person try to solve it. This is because, when a problem is underexplored, there are still many easy opportunities to make a meaningful difference that haven’t yet been tried. As more and more people get involved, those opportunities get used up, and each additional person tends to contribute less. That’s another reason to prioritize more neglected problems.
When deciding which problems to prioritize, it’s therefore important to examine not only what we could do, but also what others are likely to do regarding those problems. What we could do, however, is crucial — and we’ll discuss that in the next section.
The magnitude of the benefit we could generate
Another fundamental factor in evaluating a problem’s priority is the magnitude of the benefit we could generate by directing our efforts towards that specific problem.3 Consider the following example.
Suppose problem C involves 100 victims, each with a suffering level of −50, and problem D involves 90 victims, each with a suffering level of −40. Problem C is thus more severe (because it involves more victims who are also worse off). Suppose also that both problems are equally neglected and that it’s possible to help all the victims of either one, but that we must necessarily choose between problem C and problem D.
Based on the criteria we’ve seen so far, it seems we should prioritize problem C. However, imagine that, with the same amount of resources, we can either: (1) bring all victims of problem C from −50 to −49 (a very slight relief), or (2) bring all victims of problem D from −40 to −10 (a considerable relief). By prioritizing problem D, we would achieve a greater good with the same amount of resources.
When evaluating the magnitude of benefit, it’s crucial to estimate long-term effects
When comparing two strategies, one may generate more benefits initially, while the other — when long-term effects are taken into account — generates greater total benefit. It’s also possible for a strategy to generate large short-term benefits but have negative long-term effects, potentially even resulting in a net negative outcome overall.
In addition, it’s important to analyze whether a given strategy addresses the root cause of a problem or only alleviates its symptoms.
Why percentages can be misleading
When assessing the benefit we could generate, it’s important to focus on the number of victims who would be helped and the benefit per victim, not on the percentage of the problem that could be solved. These two things don’t always coincide. To make this clearer, consider the following example.
Suppose that, with the same resource, we can either: (1) help 90% of the animals in problem E, or (2) help an equal amount per animal for 0.1% of the animals in problem F (all of whom are in a situation as severe as those in problem E). If we go by percentages, we might think that choosing to help 90% means helping more victims. But suppose problem E involves 1 million animals and problem F involves 1 trillion. The point is: 90% of 1 million is 900,000, while 0.1% of 1 trillion is 1 billion. Solving 0.1% of problem F means helping a significantly larger number of animals with the same resource.
Is the magnitude of benefit always the most important factor?
From the above, one might conclude that the magnitude of the benefit we could generate is always the most important factor. Some people might even think it’s the only thing that matters. However, a counterexample suggests that, in certain situations, there’s another more important factor.
Let’s return to the earlier example:
·⠀Problem C: 100 victims, each with a suffering level of −50
·⠀Problem D: 90 victims, each with a suffering level of −40
Decision:
·⠀Bring 100 victims of problem C from −50 to −49 (total benefit = 100; 1 per victim)
·⠀Or bring 90 victims of problem D from −40 to −10 (total benefit = 2,700; 30 per victim)
In that case, the second option seems better, because both the degree of improvement for each victim and the total improvement are greater. But now suppose that the choice were instead between:
·⠀Bringing 100 victims of problem C from −50 to −30 (total benefit = 2,000; 20 per victim)
·⠀Or bringing 90 victims of problem D from −40 to −10 (total benefit = 2,700; 30 per victim)
Many people would say we should choose the first option (because the benefit goes to the victims who are worst off and helps a larger number of them), even though the second option generates a larger total benefit, both per victim and in aggregate.
How, then, do we know when the magnitude of benefit should carry more weight, and when the severity of the situation should? We’ll discuss how to weigh the different criteria in the next section.
How do we weigh the different criteria?
We’ve seen that the various priority criteria can conflict with each other. In the example above, we saw that the magnitude of benefit can conflict with the severity of the situation. But in reality, any criterion can conflict with any other. Different problems “score” differently on each of the criteria we’ve covered. An important question, then, is how we can make an overall assessment of different problems, taking all criteria into account. To do this, it matters whether all criteria should carry equal weight, or whether some should carry more weight than others, and whether that weight should be fixed or variable. Here are some possibilities:
(1) Total sum. Treat all factors as having equal weight and perform a general sum of how each problem scores on each factor
(2) Strong points or “trump cards.” Establish a hierarchy in which one criterion acts as a trump card over the others. This advantage can be absolute (i.e., no increase in other factors can tip the balance if it comes at a cost to the trump-card factor) or conditional (depending on how much is gained on lower-ranked factors and how little is lost on the higher-ranked one, the advantage can be reversed)
(3) Continuous relationship. There are no trump cards, and each factor carries either a fixed weight (equal or different) or a variable weight in the overall calculation. One example of this approach — where each factor carries variable weight — is the diminishing returns approach, in which the weight of each factor decreases proportionally as it becomes increasingly satisfied. One version of this would be to try to maximize benefits while treating a unit of benefit as more valuable the more severe the problem it addresses
(4) Combining trump cards and a continuous relationship. Use trump cards (absolute or conditional) up to a threshold and, beyond that, use a continuous relationship (with fixed or variable weighting)
How do problems affecting animals fit these criteria?
The number of nonhuman victims is enormously greater than the number of human victims. As we’ll see in the next section, if we consider only the harm that humans cause to animals (excluding deaths and suffering caused by natural processes), the number of animals who die each day exceeds the entire human population. If we also consider the animals who live in the wild and are affected by natural processes, there are trillions of them.4 In both cases, these animals are typically born into lives filled with extreme suffering and quite premature deaths. In short, by the severity criterion — whether measured by number of victims or by harm per victim — the situation of nonhuman animals should be among our top priorities.
Furthermore, due to speciesism,5 the problems affecting nonhuman animals are far more neglected than those affecting human beings. Causes that address problems affecting humans have far more resources and far more people already involved or donating. For example, of all charitable donations made in the United States, 97% of the total amount raised goes to human causes.6 The remaining 3% goes to environmental and animal advocacy causes (and it’s unclear how much of that 3% goes to animal advocacy specifically; what is known is that animal advocacy is far less prominent than environmentalism). Even among people who typically donate to animal causes, on average, more than two-thirds of their donations go to humanitarian causes.7 The neglectedness criterion, therefore, also points to prioritizing the situation of nonhuman animals.
Finally, one might think that the problems affecting animals have no solution — that there’s nothing that can be done. But that isn’t true. For both animals who are exploited and those who live in the wild, many things can be done (and several that are already being done) to change their situation. And often, with the same amount of resources, it’s possible to benefit a greater number of animals than human beings. The reason animals don’t receive help isn’t that the problems affecting them are intractable and no one knows what to do; it’s primarily because of speciesism. The tractability and magnitude-of-benefit criteria, therefore, also suggest that the problems affecting animals should be a priority.
Those who defend animals, then, don’t need to justify why they do so. The explanation for why impartial priority criteria aren’t being applied must come from those who don’t prioritize animal advocacy.
The most severe problems are also the most neglected within animal advocacy
We’ve seen that, despite the number of animal victims being far greater than the number of human victims, the problems affecting animals are much more neglected, due to speciesism. But the same pattern holds within animal advocacy itself: the problems affecting the greatest number of animals are also neglected by those who defend animals.
For example, of all the terrestrial vertebrates exploited in the United States,8 more than 99.7% die in animal agriculture; 0.2% die in laboratories; 0.07% die in the textile industry; and 0.03% die in shelters. Yet the amount of donations is inversely proportional to the number of animals affected. Of all donations made to animal causes in the United States,9 66% goes to shelters, 32% goes to groups with mixed activities, 0.7% goes to organizations focused on animals used in experimentation, and only 0.8% goes to organizations focused on animals exploited for food.
The same type of bias affects those who advocate for animals exploited for food. The vast majority tend to focus on mammals and birds, which means leaving out the overwhelming majority of animals used for food. Consider the following table:
| Type of exploited animal | Animals killed per year worldwide |
| Mammals and birds | Around 80 billion10 |
| Fishes raised in farms | Between 51 and 167 billion11 |
| Fishes caught directly at sea | Between 787 billion and 2.3 trillion12 |
| Aquatic animals used as feed for fishes raised for human consumption | Between 462 billion and 1.1 trillion13 |
| Crustaceans raised in farms | Between 255 and 604 billion14 |
| Silkworms killed for silk production | Between 420 billion and 1 trillion15 |
| Insects killed for consumption | Between 2 and 3.2 trillion16 |
| Cochineal insects killed to produce E-120 dye | Between 4.6 and 21 trillion17 |
| Shrimps caught directly at sea | Around 25 trillion18 |
The sum of these figures suggests that between 34 and 54 trillion animals are killed worldwide every year. This means that the 80 billion typically cited by activists represents only between 0.1% and 0.2% of the animals killed in the animal agriculture industry.
The same applies to the situation of animals affected by natural processes. Contrary to what one might initially think, their numbers are overwhelmingly greater than those of exploited animals. The vast majority of these animals have lives in which suffering predominates significantly. To give a sense of the difference, consider that the total population of sentient animals in the wild at any given moment is estimated, in some assessments, to be between 1 and 10 quintillion individuals.19 Compare this with the global population of animals raised for food: 24 billion terrestrial vertebrates,20 180 billion fishes,21 and 230 billion shrimps,22 for a total of 434 billion. These figures are so enormous that it’s hard to visualize the difference. If we use a year as an analogy, the animals raised to be exploited would represent at most 14 seconds of the year. The rest of the year — 364 days, 23 hours, 59 minutes, and 46 seconds — would correspond to the animals in the wild.
Several reasons help explain all these biases,23 including: the fact that the animals who make up the majority of victims are very different from humans and don’t elicit as much empathy; the belief that harms resulting from natural processes are less important; and the difficulty of perceiving the difference in magnitude between very large numbers. Whatever the reasons, none of them seem to justify these biases.
What about the future?
The criteria we’ve looked at also allow us to conclude that ethical questions related to the long-term future — particularly the risks of future suffering,24 also known as s-risks — should be a priority. These are the risks that new technologies could cause suffering on a gigantic scale, far beyond anything known until now (similar to what happened with the creation of industrial animal farming, which multiplied suffering enormously from that point on, only at a far greater scale). This is an issue that will affect an enormous number of sentient beings (considering those who will be affected from now on throughout history), yet there’s very little concern about it. Moreover, several things could be done to prevent these harms. It therefore fits the priority criteria very well.
This illustrates the practical usefulness of thinking in terms of priority criteria. First, we think abstractly about what criteria we might use to evaluate which problems deserve priority. Then, by applying those criteria to the real world, we find that we need to seriously rethink our priorities.
Notes
1 For several texts and links on this topic, see Šimčikas, S. (2019) “Effective animal advocacy resources”, Rethink Priorities, October 24, 2019 [accessed: April 2, 2026]. See also Cunha, L. C. (2025a) Um ativismo eficiente: critérios para escolher quais problemas priorizar e quais estratégias adotar, vol. 1, Florianópolis: Senciência e Ética [accessed on 9 April 2026].
2 On this, see Mason, E. (2023 [2006]) “Value pluralism”, in Zalta, E. N. & Nodelman, U. (eds.) The Stanford Encyclopedia of Philosophy, Summer 2023 ed., Stanford: Stanford University [accessed on 6 April 2026].
3 On this, see Dickens, M. (2016) “Evaluation frameworks (or: When importance / neglectedness / tractability doesn’t apply)”, Philosophical Multicore, June 10 [accessed on 4 April 2026].
4 Tomasik, B. (2019 [2009]) “How many wild animals are there?”, Essays on Reducing Suffering, August 7, 2019 [accessed on 8 April 2026].
5 On speciesism, see Horta, O. (2010) “What is speciesism?”, Journal of Agricultural and Environmental Ethics, 23, pp. 243-266 [accessed on 2 May 2026].
6 Kateman, B. (2021) “The environment and animals deserve more than just 3% of our charitable giving”, Forbes, November 23 [accessed on 9 April 2026].
7 Anderson, J. (2018) “Donation preferences and attitudes among people who donate to animal causes”, Faunalytics, October, p. 9 [accessed on 8 April 2026].
8 Animal Charity Evaluators (2024) “Why farmed animals?”, Animal Charity Evaluators [accessed on 7 April 2026].
9 Ibid.
10 Our World in Data (2018) “Yearly number of animals slaughtered for meat, World, 1961 to 2018”, Our World in Data [accessed on 15 April 2026]. Sanders, B. (2025) “Global animal slaughter statistics & charts”, Faunalytics, April 23 [accessed on 9 April 2026].
11 fishcount.org.uk (2019a) “Fishcount estimates of numbers of individuals killed in (FAO) reported fishery production”, fishcount.org.uk [accessed on 7 April 2026].
12 Ibid.
13 Ibid.
14 Ibid.
15 Rowe, A. (2021) “Silk production: Global scale and animal welfare issues”, Rethink Priorities, April 19, 2021 [accessed on 5 April 2026].
16 Rowe, A. (2020a) “Insects raised for food and feed — global scale, practices, and policy”, Rethink Priorities, June 29, 2020 [accessed on 8 April 2026].
17 Rowe, A. (2020b) “Global cochineal production: Scale, welfare concerns, and potential interventions”, Effective Altruism Forum, February 11 [accessed on 7 April 2026].
18 Waldhorn, D. & Autric, E. (2023) “Shrimp: The animals most commonly used and killed for food production”, OSF Preprints, September 8 [accessed on 11 April 2026].
19 National Museum of Natural History & Smithsonian Institution (ca. 2008) “Numbers of insects (species and individuals)”, Encyclopedia Smithsonian [accessed on 14 April 2026]. Tomasik, B. (2019 [2009]) “How many animals are there?”, op. cit.
20 Tomasik, B. (2019 [2009]) “How many animals are there?”, op. cit.
21 fishcount.org.uk (2019b) “Numbers of farmed fishes slaughtered each year”, fishcount.org.uk [accessed on 11 April 2026].
22 Waldhorn, D. & Autric, E. (2023) “Shrimp: The animals most commonly used and killed for food production”, op. cit.
23 On this, see Cunha, L. C. (2025b) “Vieses e sua influência: como vieses influenciam nossas decisões que afetam os animais”, vol. 1, Florianópolis: Senciência e Ética [accessed on 13 April 2026].
24 On s-risks, see Baumann, T. (2017) “S-risks: An introduction”, Center for Reducing Suffering [accessed on 4 April 2026]; (2022) Avoiding the worst: How to prevent a moral catastrophe, Colville: Center for Reducing Suffering [accessed on 1 April 2026]. See also Cunha, L. C. (2025c) A ética e o futuro: o que são riscos de sofrimento futuro e como preveni-los, vol. 1, Florianópolis: Senciência e Ética [accessed on 13 April 2026].